Introduction:
In the financial markets, the Bank Nifty index has taken center stage, unveiling a series of intriguing developments that offer valuable insights and predictions for the week ahead. As we dissect the nuances of this dynamic landscape, we delve into the technicalities, resistance and support levels, and potential market movers that can shape the journey of the Bank Nifty index.
Weekly Performance and Technical Analysis of Bank Nifty:
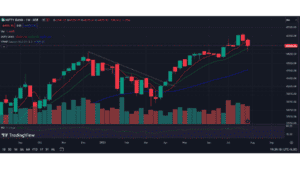
Reflecting on the past week’s performance, the Bank Nifty index embarked on a journey that bore significant implications for traders and investors alike. The index achieved a high of 45782.75 before closing the session at 44879.50 levels, representing a decline of 1.29 percent compared to the previous week’s close.
A closer inspection of the weekly chart paints a vivid picture. The index’s journey was marked by the formation of a bearish candle, signaling a shift from the prevailing bullish momentum. This bearish candle acted as a pivot point, inviting further analysis into the forces that influenced its emergence.
The Relative Strength Index (RSI) momentum indicator emerged as a key player in this narrative. Currently trading around 60 levels, the RSI adds a layer of insight into the sentiment that underscored the week’s performance. This level hints at a balance between bullish and bearish forces, signifying a state of equilibrium in the market.

Support and Resistance Dynamics:
A pivotal aspect of analyzing the Bank Nifty index involves identifying crucial support and resistance levels that can shape its trajectory. The low of the bearish candle, positioned at around 44279.40 levels, emerges as a formidable support for the index. Notably, this support level served as a launchpad for a sharp rebound, underscoring its significance in influencing market movements.
On the flip side, the index faces resistance levels that demand attention. Weekly charts reveal a smaller resistance at 45650 levels. Sustaining above this level could pave the way for upward movement towards all-time high levels of 46310 and beyond. This resistance and potential breakout point mirror the delicate balance between bullish aspirations and technical barriers.
Key Stock Insights:
Beyond the index itself, individual banking stocks within the Bank Nifty hold the potential to shape its overall trajectory. Analysis points towards HDFCBANK potentially outperforming the Bank Nifty index, offering a front-runner perspective for traders. Similarly, INDUSINDB BANK emerges as another candidate in the private banking sector that could drive market movements.
In the realm of PSU banks, attention is drawn to PNB and CANBK. These stocks are anticipated to ascend higher, potentially delivering substantial gains throughout the coming week. Their trajectories within the broader banking landscape mirror the intricate dynamics that define the sector.
Futures and Option Analysis:
Derivative markets offer further insights into the anticipated trajectory of the Bank Nifty index. AUGUST futures for the Bank Nifty are trading at a 121.70-point premium to the Bank Nifty spot. This premium reflects market sentiment, offering a glimpse into the market’s outlook for the immediate future.
Examining Bank Nifty Futures levels, it’s noteworthy that they successfully closed above the crucial 45000 mark, settling at 45001.60 levels. This level represents a technical milestone, potentially guiding the index’s movement in the days to come.
Option Concentrations:
A deep dive into option distributions unveils concentrations that can influence market movements. Bank Nifty Put options reveal that the 44500 level holds the highest concentration, potentially serving as a support for the ongoing expiry period. On the Call side, strikes at 45500 and 46000 exhibit significant Open Interest (OI) concentrations. These levels may act as resistance points, dictating the range within which the index’s movement could unfold.
Strategic Outlook and Potential Bias:
Armed with these analyses and insights, a strategic outlook for the week ahead emerges. The Bank Nifty index appears poised for a potentially sideways to bullish bias. The equilibrium captured by the RSI, the pivotal support and resistance levels, and the interplay of individual banking stocks all contribute to this nuanced perspective.
As the week unfolds, market participants and traders will navigate the intricate dance between support and resistance, sentiment and technicals. The Bank Nifty’s journey offers a microcosm of the broader market dynamics, underscoring the importance of a comprehensive approach that merges technical analysis with insights into individual stocks.
In the weekly charts, a subtle hurdle emerges at the 45650 mark, revealing a nuanced resistance. Should the Bank Nifty successfully maintain its position above this demarcation, a trajectory towards the pinnacle of all-time highs at 46310 and beyond becomes an enticing prospect.
Conversely, an unwavering pillar of support is nestled around the 44590 levels, coinciding with the 50-Day Exponential Moving Average (EMA) milestones. A potential scenario where the index concludes its session below this steadfast foundation could usher in a paradigm shift in momentum, guiding it towards the downside.
Support: 44300-44590
Resistance: 45650-45900
Bias : Sideways to Bearish
Conclusion:
In conclusion, the Bank Nifty index’s trajectory in the upcoming week offers both challenges and opportunities. Armed with a strategic understanding of key levels, individual stock dynamics, and derivative market insights, traders can navigate this landscape with confidence, capitalizing on the potential for profitable outcomes. As the week progresses, all eyes are on the Bank Nifty, a canvas where market forces paint a story of resilience, ambition, and potential gains.

Pingback: Revolutionizing BharatNet Project: Empowering Last-Mile Broadband Connectivity Transformation - Finance By Chance1
Pingback: Strategic Insights: Empowering Bank Nifty Predictions for a Profitable Week Ahead - Finance By Chance1